
A 96 well plate template is two things at once. It is an 8 by 12 grid you fill in by hand, and it is the record that says which sample sat in which well. The grid is the easy half. The record is where plate work goes wrong, because published data show that a well’s position changes the measurement, that neighbouring wells exchange material, and that the layout you pick changes the numbers you end up reporting.
The grid below sits on this page as a plain table. It prints with the page, and it pastes into Excel or Google Sheets as cells.
The grid: rows A to H, columns 1 to 12
| 1 | 2 | 3 | 4 | 5 | 6 | 7 | 8 | 9 | 10 | 11 | 12 | |
|---|---|---|---|---|---|---|---|---|---|---|---|---|
| A | ||||||||||||
| B | ||||||||||||
| C | ||||||||||||
| D | ||||||||||||
| E | ||||||||||||
| F | ||||||||||||
| G | ||||||||||||
| H |
The grey cells are the outer ring. There is a reason to mark them, and it comes further down this page.
What belongs on the plate map, not only on the grid
A filled grid tells you where a sample is. It does not tell you what else went into the well, and that is usually the thing you need three months later when one column of results sits apart from the rest. Keep these columns next to the grid:
- plate ID, and the date the plate was filled
- well, in one fixed notation: A1 to H12
- sample ID, and the sample type: sample, blank or control
- what was dispensed into the well, with a number: beads by count and diameter, powder by volume, seeds by count
- who filled the plate, and with which dispenser or mesh plate
- the run order, if the plate was processed in batches
The fourth line is the one most often left empty. Bead counts per well are specified in some protocols and not in others, and the unit differs between papers; we went through four of them in an earlier article on how many tissue homogenizer beads go per tube or well.
One formula builds the whole well list
If your LIMS or your analysis script wants one row per well instead of a grid, you do not have to type 96 cells. Put a header in row 1, paste this in A2 and fill down 96 rows:
=CHAR(65+INT((ROW()-2)/12))&(MOD(ROW()-2,12)+1)That gives A1, A2, A3 and on, finishing each row before moving down. For the other reading order, down each column first, use:
=CHAR(65+MOD(ROW()-2,8))&(INT((ROW()-2)/8)+1)Write down which of the two orders your template uses. A plate map made in row order and read in column order moves every sample except A1 and H12.
A well’s position is not neutral
Mansoury and co-workers cultured mammalian cells in 96 well plates for 72 hours and measured metabolic activity with MTS. On plates from one supplier the outer wells came out 35 percent lower than the central wells, with rows two and three 25 percent and 10 percent lower. On plates from a second supplier the same comparison gave 16, 7 and 1 percent. Storing the plates in loosely sealed wrapping during incubation reduced the effect. Their conclusion was that each laboratory has to measure its own plates rather than assume a brand is fine (Mansoury et al., 2021).
What that asks of a template is small and worth doing: mark the outer ring, as the grid above does. If real samples go there, the position stays in the record, and a result that sits apart can be checked against it instead of guessed at.
Neighbouring wells are not independent either
Minich and co-workers gave every well in a plate its own known bacterium, then counted how often sequences from one well turned up in another. Well-to-well contamination happened mostly during DNA extraction and to a lesser extent during library preparation. It occurred mainly between neighbouring wells, with rare events up to ten wells apart, and it hit low-biomass samples hardest. Their advice was to randomise samples across the plate and to process samples of similar biomass together (Minich et al., 2019).
Brennan and co-workers name the mechanism in a 96 well plate directly: the shared seal and the weak separation between wells. Measuring 16S rRNA gene levels by qPCR, they found less well-to-well contamination when samples were collected in individually sealed barcoded tubes instead of a plate (Brennan et al., 2024).
Both papers turn the template into a design decision rather than paperwork. If one plate holds a high-biomass and a low-biomass set, the grid should show which is which, and the two should not be interleaved well by well.
The layout changes the statistics
Francisco Rodriguez, Carreras Puigvert and Spjuth treated plate layout as a constraint problem and compared designed layouts against the conventional random ones. The designed layouts gave better IC50 and EC50 estimates in dose-response work, and they avoided inflated values of the Z prime factor and SSMD, the two quality metrics most screens are judged on. Their toolkit, PLAID, is published with the paper (Francisco Rodriguez et al., 2023).
The short version: where the controls sit is part of the method. If your template puts every control in column 1, that belongs in the methods section, not only on the printout taped to the bench.
What a template does not fix
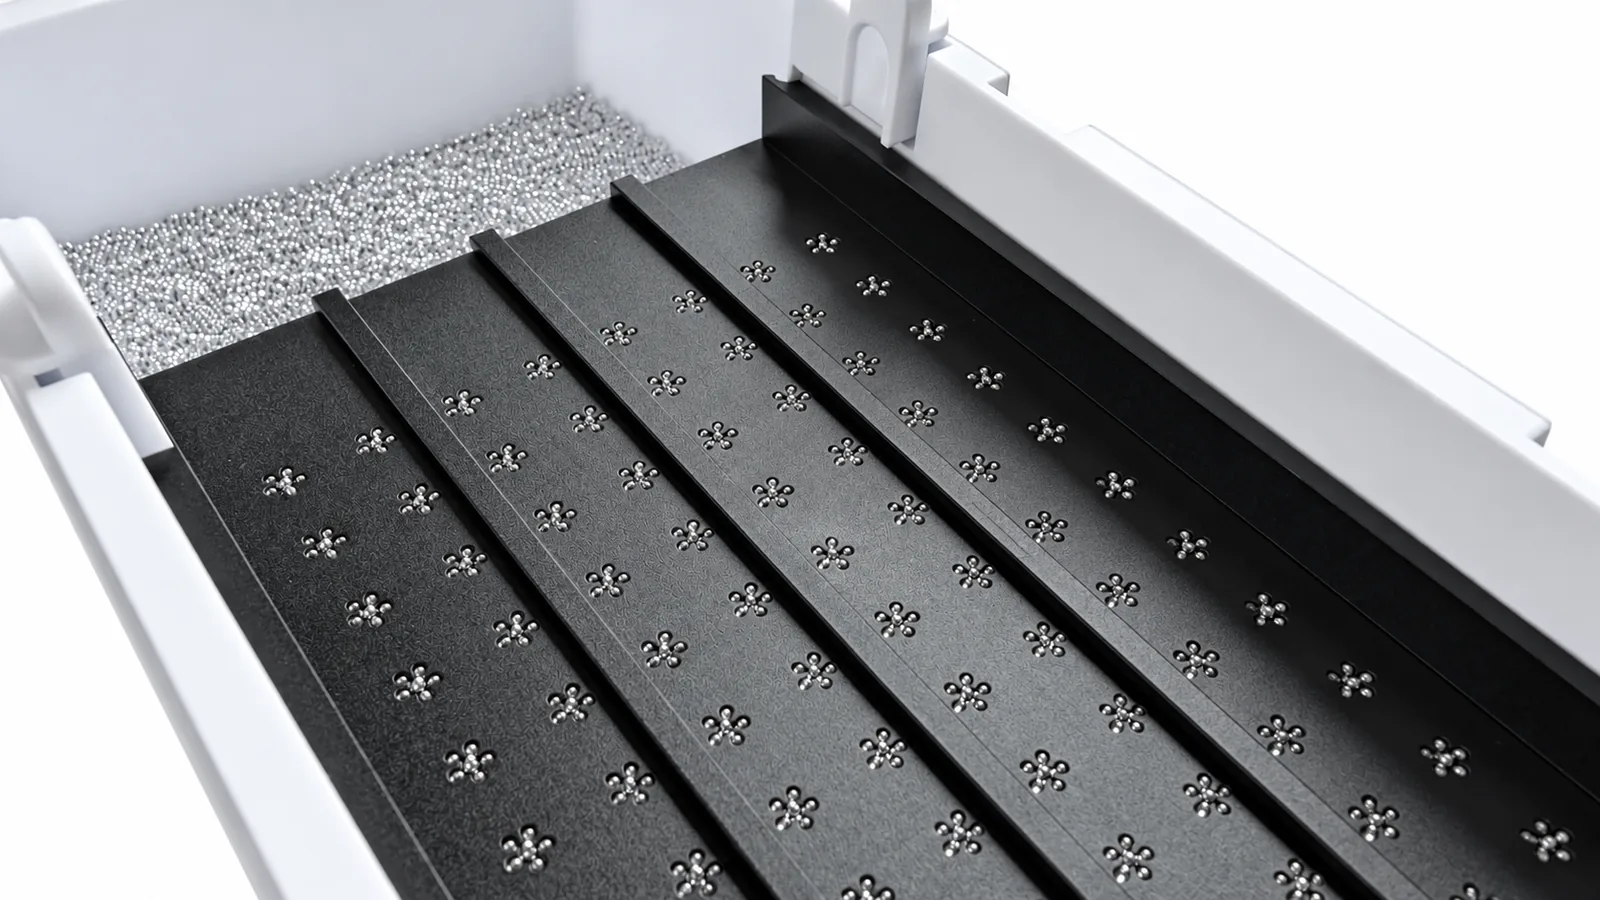
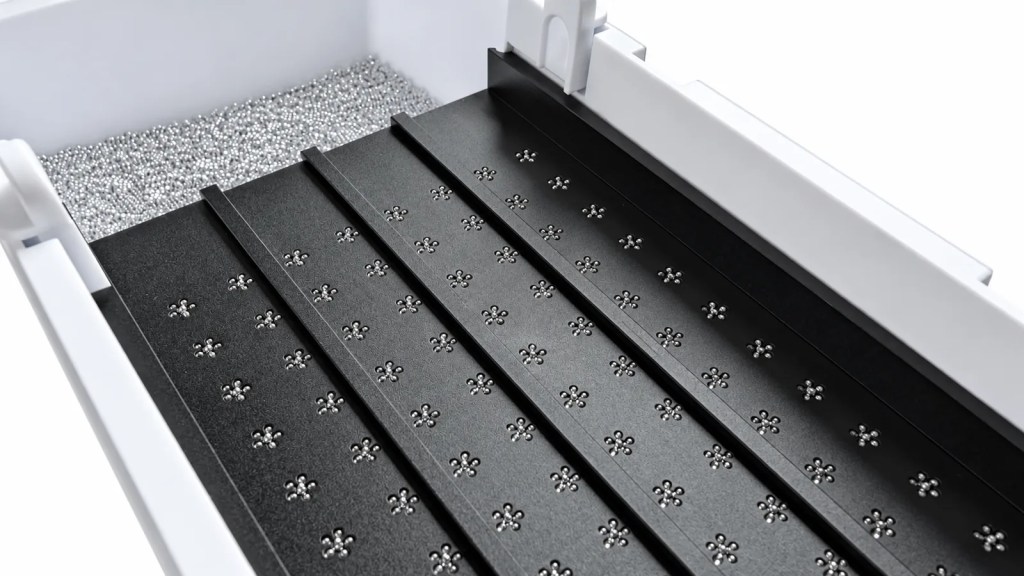
A template records intent. The plate holds whatever actually went in. The two drift apart during filling, and no grid catches that: a well with two beads instead of one, a seed that bounced out, a well skipped at the end of a long morning. That is a loading problem, and it is solved by geometry rather than by attention. The 96-Well Bead Dispenser drops beads into all 96 wells in one slider motion, the 96-Well Powder Dispenser doses the same volume into every well, and the 96-Well Seed Dispenser places one seed per well. What none of them do is write anything down. The dispenser places, the template records, and you need both.
The second limit is simpler. A position effect can only be corrected afterwards if the position was written down in the first place. That is the whole case for the plate map, and it is why the grid above carries the plate ID and the date.
Sources
- Mansoury M, Hamed M, Karmustaji R, Al Hannan F, Safrany ST. The edge effect: A global problem. The trouble with culturing cells in 96-well plates. Biochemistry and Biophysics Reports. 2021;26:100987. https://doi.org/10.1016/j.bbrep.2021.100987
- Minich JJ, Sanders JG, Amir A, Humphrey G, Gilbert JA, Knight R. Quantifying and understanding well-to-well contamination in microbiome research. mSystems. 2019;4(4):e00186-19. https://doi.org/10.1128/mSystems.00186-19
- Brennan C, Belda-Ferre P, Zuffa S, et al. Clearing the plate: a strategic approach to mitigate well-to-well contamination in large-scale microbiome studies. mSystems. 2024;9(10):e00985-24. https://doi.org/10.1128/msystems.00985-24
- Francisco Rodriguez MA, Carreras Puigvert J, Spjuth O. Designing microplate layouts using artificial intelligence. Artificial Intelligence in the Life Sciences. 2023;3:100073. https://doi.org/10.1016/j.ailsci.2023.100073
Written by Bas Millenaar, LabTIE International B.V., labtie.com. LabTIE builds manual seed, bead and powder dispensers for 96-well plates, 384-well plates, tubes and vials.
Leave a Reply