
A seed germination test answers one question well: what fraction of this lot sprouts. You wet a substrate, lay out a counted sample, wait the prescribed number of days and divide. The answer is a percentage, and it belongs to the lot, not to any seed in it. When 88 of 100 come up, the test cannot tell you which twelve failed, or whether they were the small ones, the thin ones, or the ones that already looked wrong before they went down.
Three recent papers went after the per-seed answer instead, each scoring individual seeds without destroying them. Reading their methods side by side, the interesting thing is not the models they built. It is that all three ran into the same wall, and it was not biology. It was the step where seeds get laid out.
Three ways to score a seed before it germinates
Tu and colleagues set out to predict maize seed vigour from images alone, across 368 inbred lines. They imaged the embryo surface of each seed, hyperspectrally and then again on a flatbed scanner, and trained models to separate high from low vigour (Tu K, Wen S, Xu Y, He H, Li H, Xu R, Guo B, Sun C, Gu R, Sun Q, 2025, Journal of Advanced Research 76:45-56, doi.org/10.1016/j.jare.2024.12.022).
Karimpour and colleagues asked a narrower question about tree seed: does this seed contain an embryo at all. Two hundred Acer monspessulanum seeds were dewinged by hand, numbered one to a hundred in duplicate, laid out on gridded paper and photographed under standard lighting. Each seed was photographed three times over the course of the work: before treatment, after treatment, and again after the embryo was taken out (Karimpour S, Ahmadi Sarcheshme M, Karimpour S, 2026, Advances in Horticultural Science 40(1):85-97, doi.org/10.36253/ahsc-18597).
Díaz-Álvarez and colleagues took the spectral route on lupin, sorting seeds of seven Lupinus species into sweet and bitter. Whole seeds went onto a 150 mm turntable turning at 22 rpm under a halogen source, each sample measured in quadruplicate, each spectrum the average of 25 consecutive scans, for 871 spectra in all (Díaz-Álvarez J, Galea-Gragera FA, Chávez de la O F, Salguero-López PA, Llera Cid F, 2026, Frontiers in Artificial Intelligence 9:1745720, doi.org/10.3389/frai.2026.1745720).
The tray decided the sample size
Tu’s paper says it in plain words. The carrier platform had a size limit, seeds differ in size between lines, and so the number of seeds per line was not a choice but a consequence: most lines contributed 30 seeds to the hyperspectral set, the large-grained ones around 20. For the scanner the limit was the glass, 216 by 297 mm, and 90 seeds were taken per line to fill it.
Read that again with a germination test in mind. The statistical power of the whole study, across 368 lines, was set by how many seeds fit on a plate and could be placed there one at a time, embryo side up. Not by how many seeds existed. Not by how much material the breeders had. By the tray.
Karimpour’s design shows the other cost of the same step. Two hundred seeds, three photographs each, is six hundred occasions on which a seed has to be in a known, recorded position. The numbering and the gridded paper exist for exactly one reason: so that image three can be matched to image one for the same seed.
And in the lupin work the seed count per reading is not reported at all. The paper is precise about the turntable, 150 mm, about the rotation, 22 rpm, about the averaging, 25 scans, and silent on how many seeds sat on the disc. That is not sloppiness; it is what happens to a step everyone treats as too obvious to write down.
What this changes for a germination test
If a lot-level percentage is all you need, none of this matters and your current method is fine. It matters the moment you want to connect something measured before the test to what that same seed did during it: an image, a spectrum, a weight, a seed-coat score. That link only exists if the position was fixed before the substrate got wet, because afterwards there is no way to reconstruct which seed was which.
In practice that means four things:
- One seed per position, on a grid with a known spacing, not scattered on a sheet.
- The same grid in the pre-test measurement and in the germination tray, or a written map between the two.
- A photograph of the filled layout before wetting, which costs ten seconds and is the only cheap insurance against a shifted tray.
- Scoring by position rather than by count. You write down which positions germinated, and the percentage falls out of that instead of replacing it.
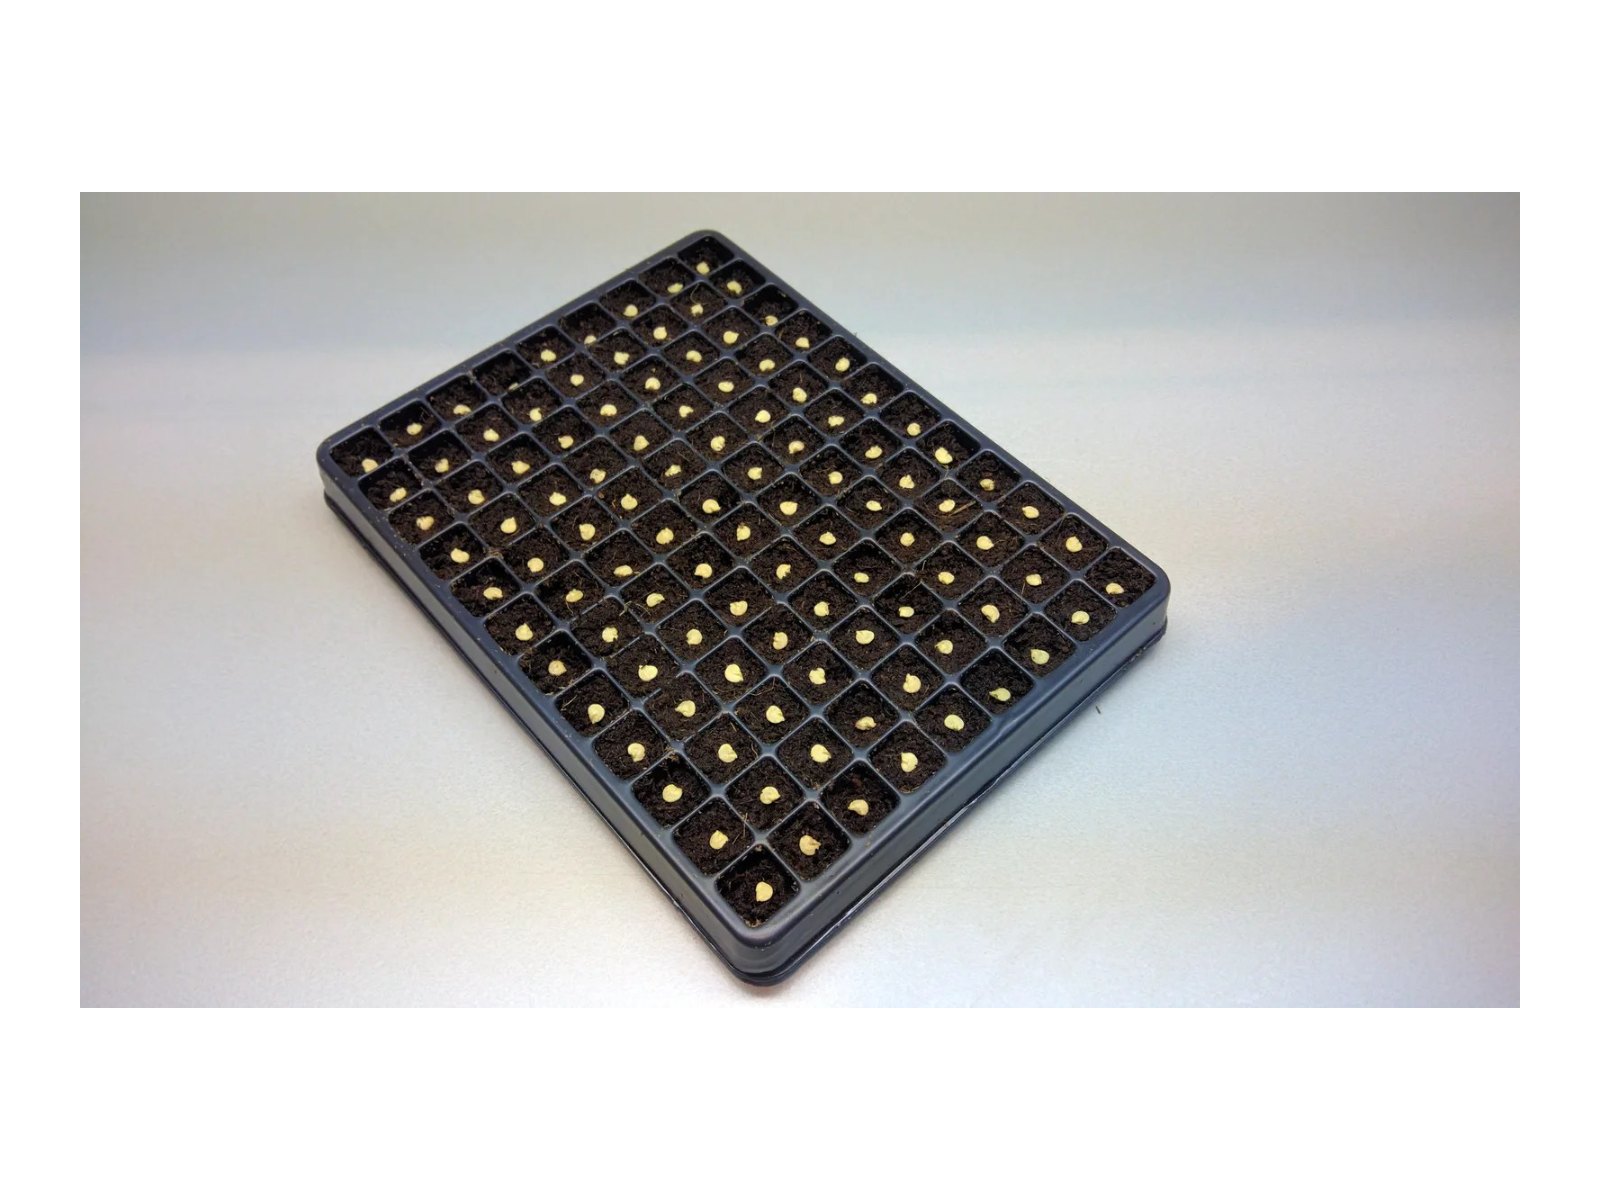
Point one is where most of the time goes, and it is the point these three papers all paid for. Placing seeds one position at a time with forceps or a moistened stick is slow, and the seeds that are hardest to place, the small and the round ones, are usually the ones you have most of. A mesh plate with an opening cut for the species holds one seed per position and releases the whole grid in a single motion, which is what our 100-well tray seed dispenser does onto a blot paper germination tray, and our round petri dish seed dispenser does onto a dish. For extraction work rather than germination, the 96-well seed dispenser fills a plate on the same principle. We wrote about the plate version of this job in how do you fill a 96-well plate with seeds.
Where a fixed grid does not help
Three honest limits, and the first one is the real one.
Placing is not orienting. Tu’s method needed the embryo surface facing the camera. A dispenser puts one seed in every position; it does not decide which way up that seed lands. For any measurement that depends on which face is visible, the turning is still handwork, and the honest reading of that paper is that the layout got faster and the orientation did not.
Second, per-seed traceability is extra work you should only take on when something downstream uses it. A routine certification test asks for a percentage on a counted sample, and a grid buys you nothing there except a tidier tray.
Third, averaging is sometimes right. The lupin study measured per sample and not per seed on purpose, because the question was about a species-level compound and not about individual seeds. Not reporting the seed count is a gap in the write-up; measuring in bulk was a reasonable design.
Sources
- Tu K, Wen S, Xu Y, He H, Li H, Xu R, Guo B, Sun C, Gu R, Sun Q. Non-destructive detection strategy of maize seed vigor based on seed phenotyping and the potential for accelerating breeding. Journal of Advanced Research. 2025;76:45-56. https://doi.org/10.1016/j.jare.2024.12.022
- Karimpour S, Ahmadi Sarcheshme M, Karimpour S. Non-destructive detection and quantification of embryo presence in Acer monspessulanum seeds using neural networks. Advances in Horticultural Science. 2026;40(1):85-97. https://doi.org/10.36253/ahsc-18597
- Díaz-Álvarez J, Galea-Gragera FA, Chávez de la O F, Salguero-López PA, Llera Cid F. Classification of Lupinus seeds into sweet and bitter categories using VIS-NIR spectroscopy and machine learning. Frontiers in Artificial Intelligence. 2026;9:1745720. https://doi.org/10.3389/frai.2026.1745720
Leave a Reply